Our guiding principle is simple: lower contaminant levels are always better. Few product categories illustrate that principle more than cat food. Most cats eat the same foods—or a small rotation of foods—every day for their entire lives. Without any dietary variety, any contaminants present in the foods a cat eats can become a consistent and ongoing source of exposure, potentially accumulating in their bodies over the course of
their lives.
Nearly two out of every five American homes have a cat. Today, 49 million U.S. households own a cat, up from 40 million in 2023, and the number of households with three or more cats increased by 36% from 2018 to 2024. The number of cat food brands has grown as well, with Cascadia Consulting estimating U.S. cat food and treat sales reached approximately $18.4 billion in 2025, up roughly 11%.
Cat owners are increasingly choosing premium, natural, and specialty products, often assuming that a higher price or a cleaner ingredient label means a cleaner product. Premium product sales have grown 6% since 2019. But whether these products actually contain fewer contaminants has never been evaluated across the category. Until now. Cats are unique animals with unique dietary needs. As obligate carnivores, they eat a high-protein diet drawn heavily from animal tissue, including fish that can contain mercury. Their kidneys carry the long-term burden of metal accumulation, and chronic kidney disease is among the most common causes of death in older cats.
Contaminant levels in this report are expressed per 1,000 kilocalories, not per kilogram of food (e.g., micrograms per 1,000 kilocalories, not parts per billion). This is especially significant in cat food, more so than in almost any other product category. The products in this study ranged from 547 to 5,290 kcal/kg—wet food is roughly a quarter as calorie-dense as dry, largely because wet food contains substantially more water than dry food. A cat eating wet food must consume about four times the weight of food to get the same calories. Because the water in wet food dilutes the contaminants present in the ingredients themselves, measuring per kilogram of food would make wet food look several times cleaner than it is, purely as an artifact of its water content.
You can read more about how we measured and reported contaminants in our full report.
Discover verified products tested by Clean Label Project, build smarter grocery lists, and stay informed with the latest health and food safety news.


Clean Label Project® purchased 100 cat food products from 62 brands across three product formats: dry (kibble, n=31), wet (canned and pouch, n=40), and air-dried or freeze-dried (n=29).
Testing was performed by an independent analytical chemistry laboratory that holds ISO 17025 accreditation for the methods involved. Heavy metals—arsenic, cadmium, lead, and mercury—were measured by inductively coupled plasma mass spectrometry (ICP-MS). Bisphenols, acrylamide, glyphosate, AMPA, and our pesticide and phthalate panels were measured by liquid chromatography tandem mass spectrometry (LC-MS/MS). In total, Clean Label Project® tested these 100 products for more than 122 environmental contaminants and toxins.
Every result was evaluated against the method’s detection and quantification limits. Results below the detection limit are reported as non-detect; results between detection and quantification are reported as “trace,” meaning the contaminant was present at very low levels. Even low-level exposures can be meaningful when cats consume the same food every day for their entire lives. We account for uncertainty in the data rather than making assumptions about results near the detection limit. This helps provide a more accurate picture of the findings.
Results were converted to a per-1,000-kcal basis using each product’s labeled caloric density, and each product was ranked within the category.
Ingredient lists were obtained for all 100 products we tested and were classified into sixteen ingredient categories, which allowed us to test for associations between certain ingredients and contaminant levels directly rather than inferring them from product names.
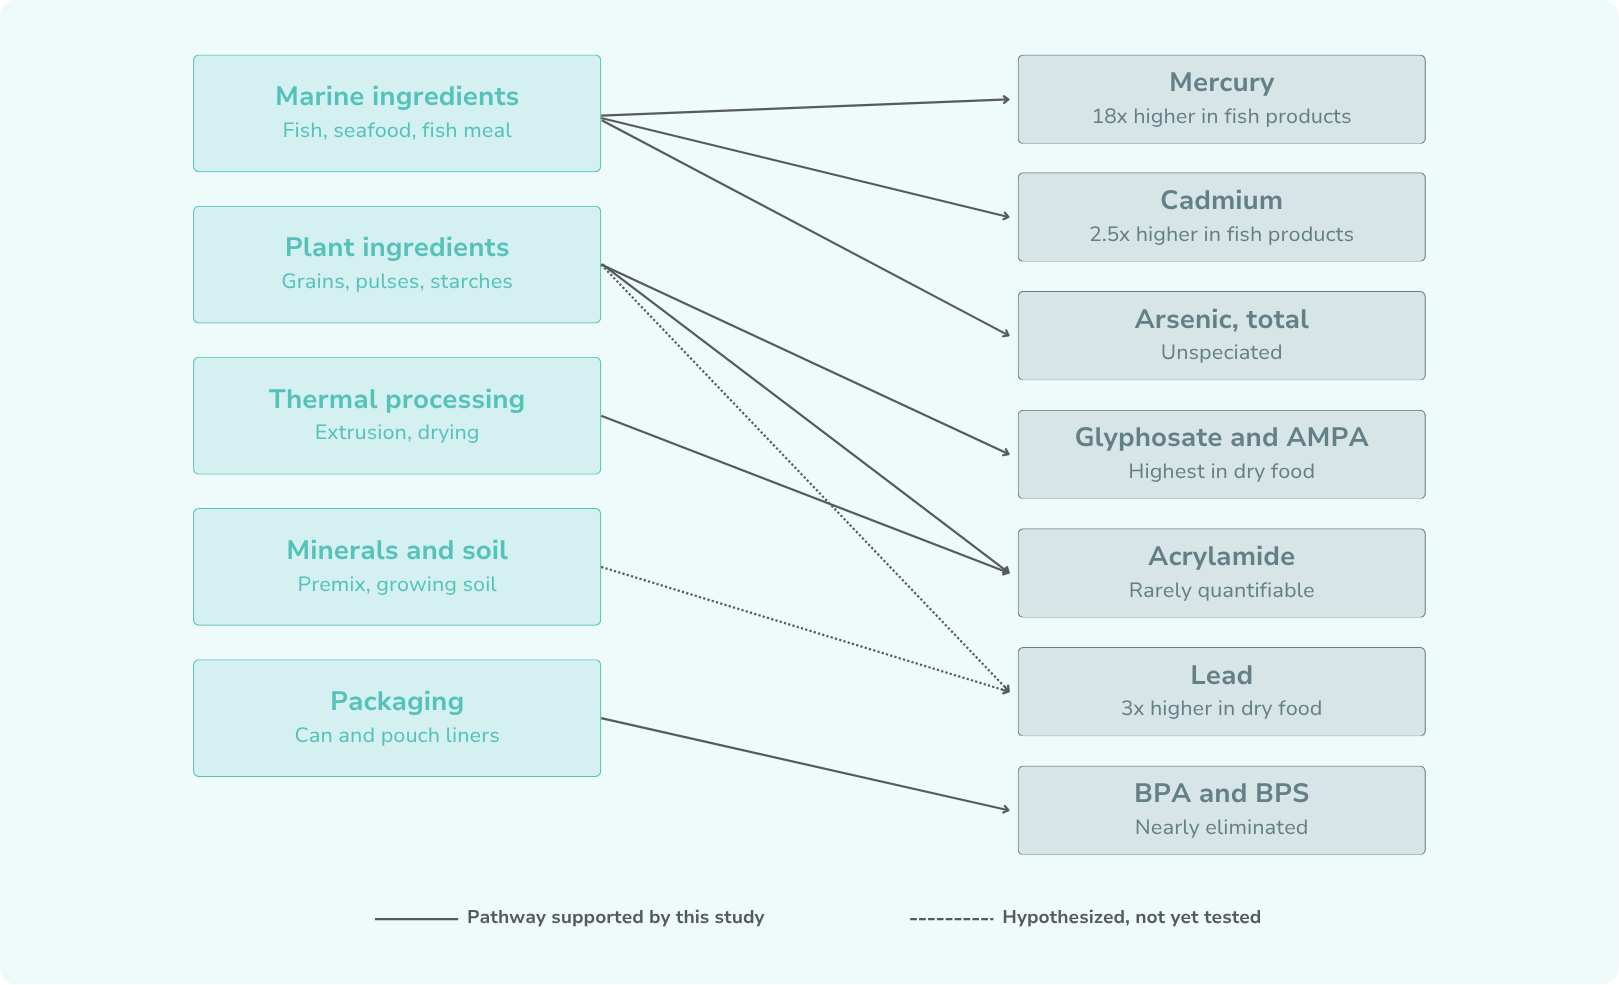
Products whose names included fish or seafood carried about 18x the mercury of other products, even after accounting for whether they were wet or dry. Among wet foods, the difference was even larger: fish-based wet products had about 28x as much mercury as wet foods made with other proteins. We do have some fish-based products that made the CLEAN SIXTEEN list.
Nearly half (48.6%) of fish and seafood products ranked among the highest for mercury levels. No poultry-based products did.
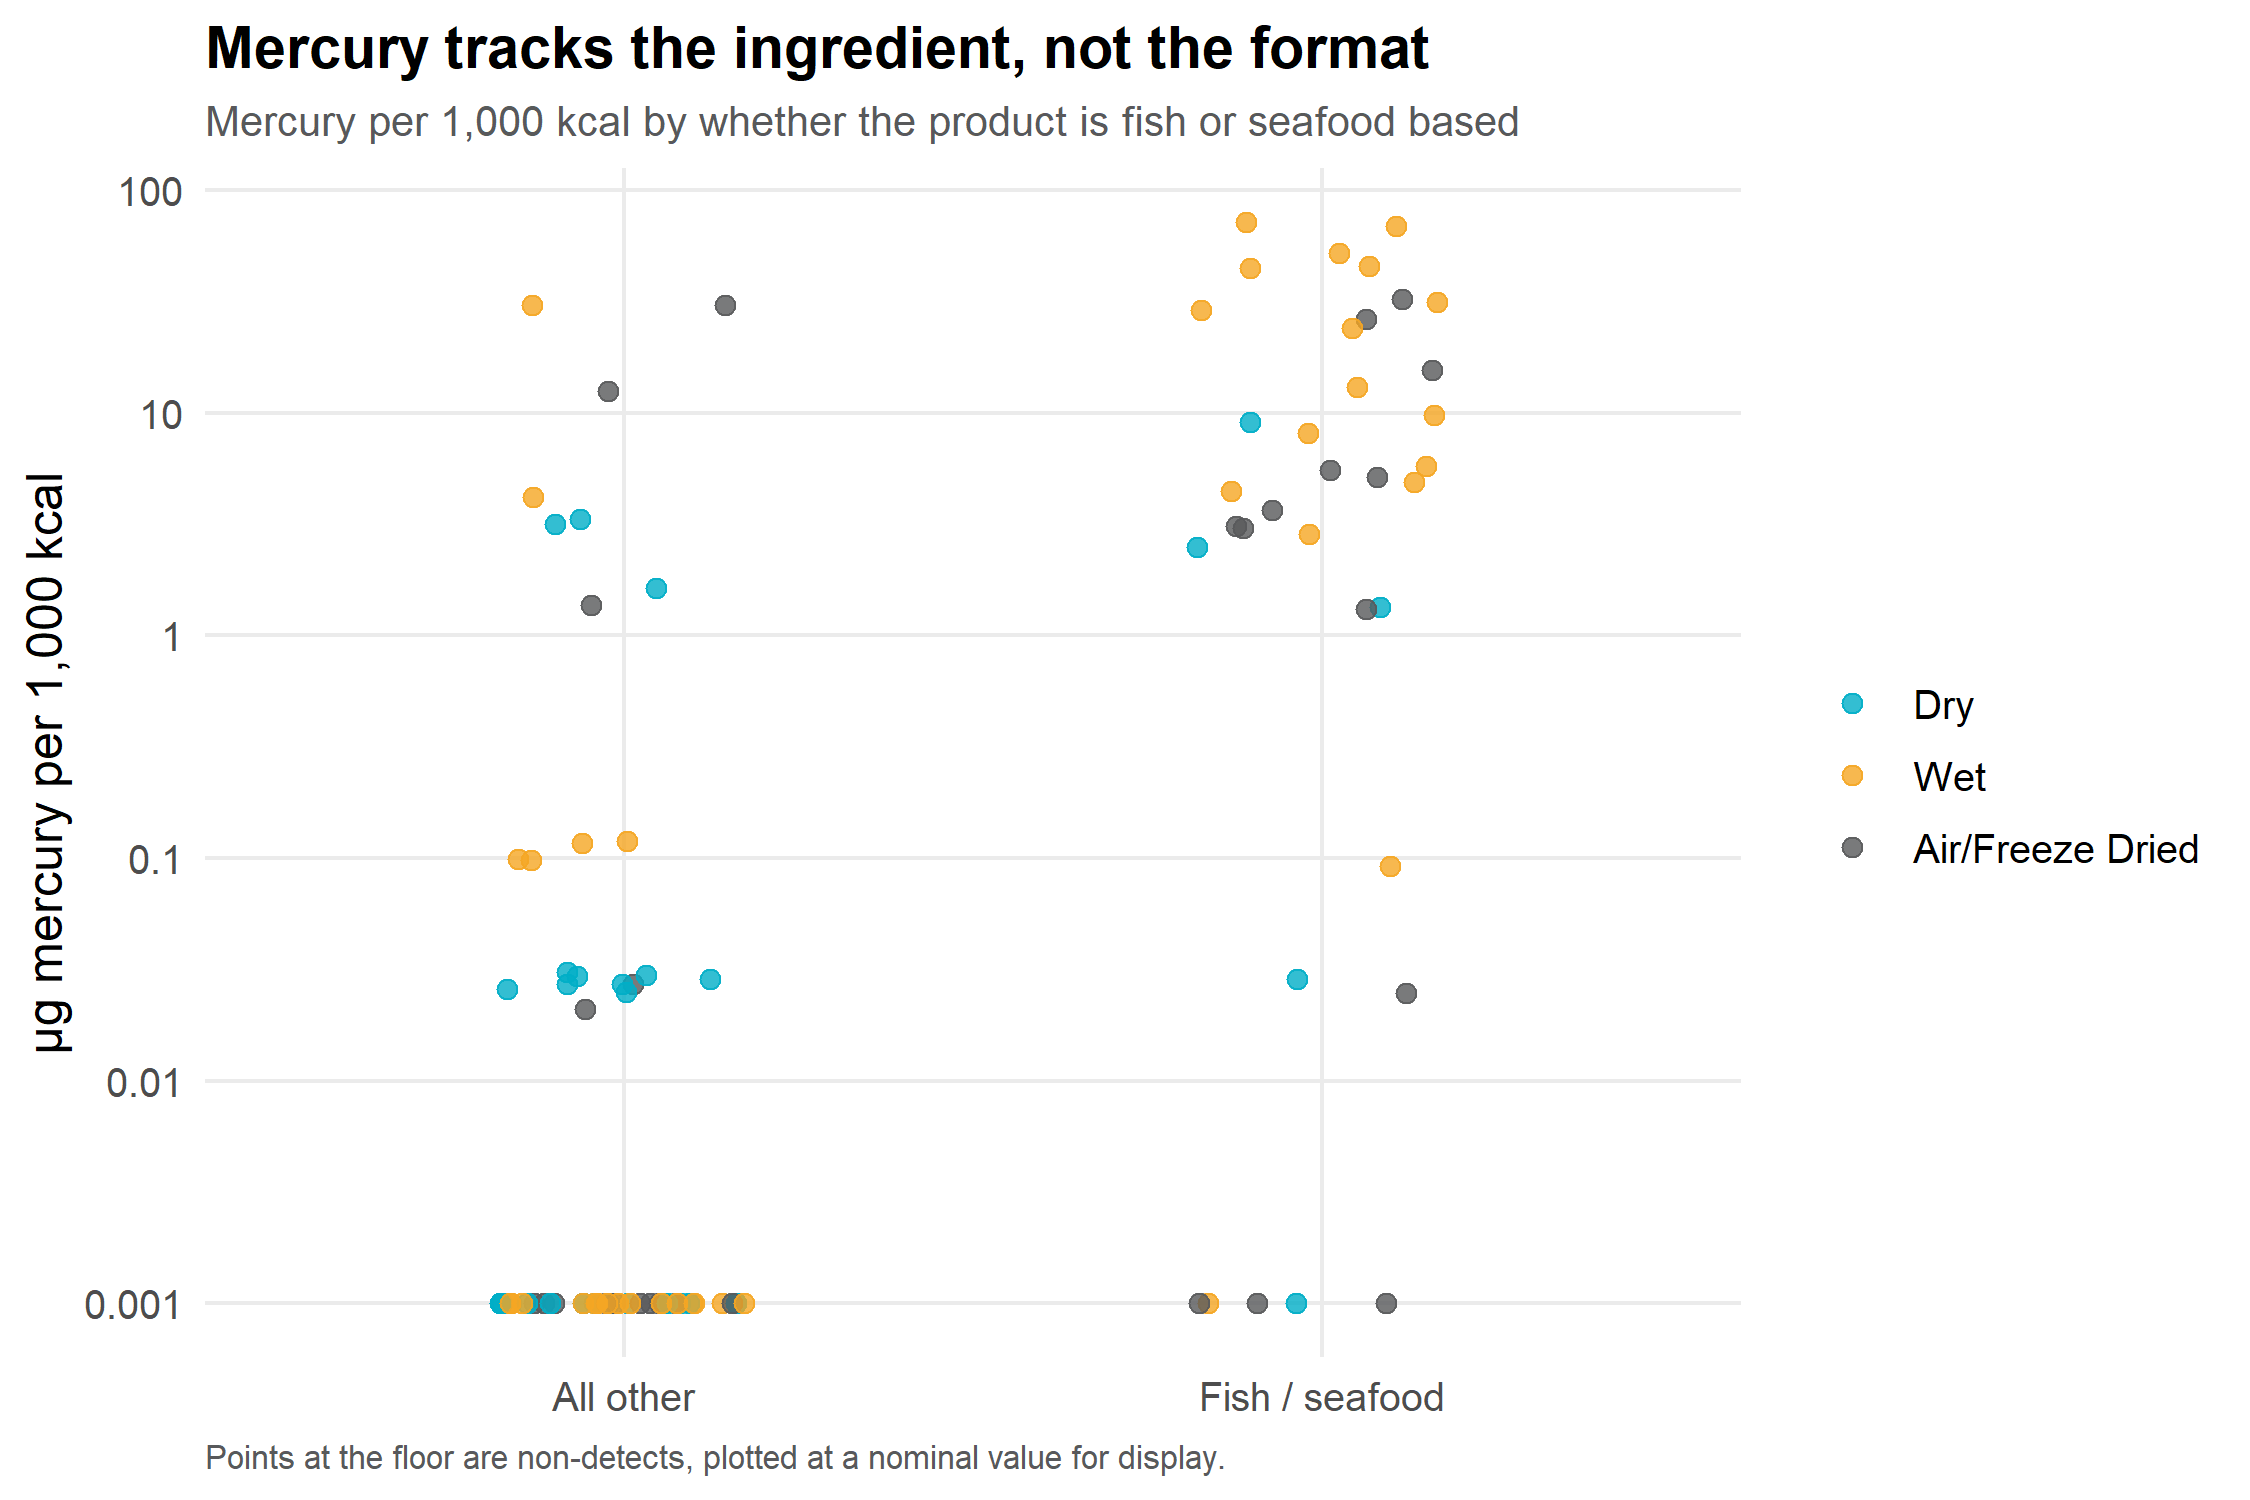
This is a known pathway: mercury accumulates in marine animals through the food chain, and fish-based cat foods can contain ingredients that carry these higher levels. For cat owners, this is one of the most useful findings because the protein source is often listed right on the front of the package.
The connection between seafood and mercury is not unique to cat food. The U.S. FDA cautions pregnant or breastfeeding women on choosing safer seafood options to help reduce mercury exposure. The difference for cats is that a seafood-based diet may be their only source of calories every day, for their entire lives.
Products that did not have fish in the name but still contained a marine ingredient still tended to have more mercury than products with no marine ingredients. The takeaway for cat owners: if you’re trying to reduce mercury exposure, read the ingredient list carefully—the product name alone may not tell the full story.
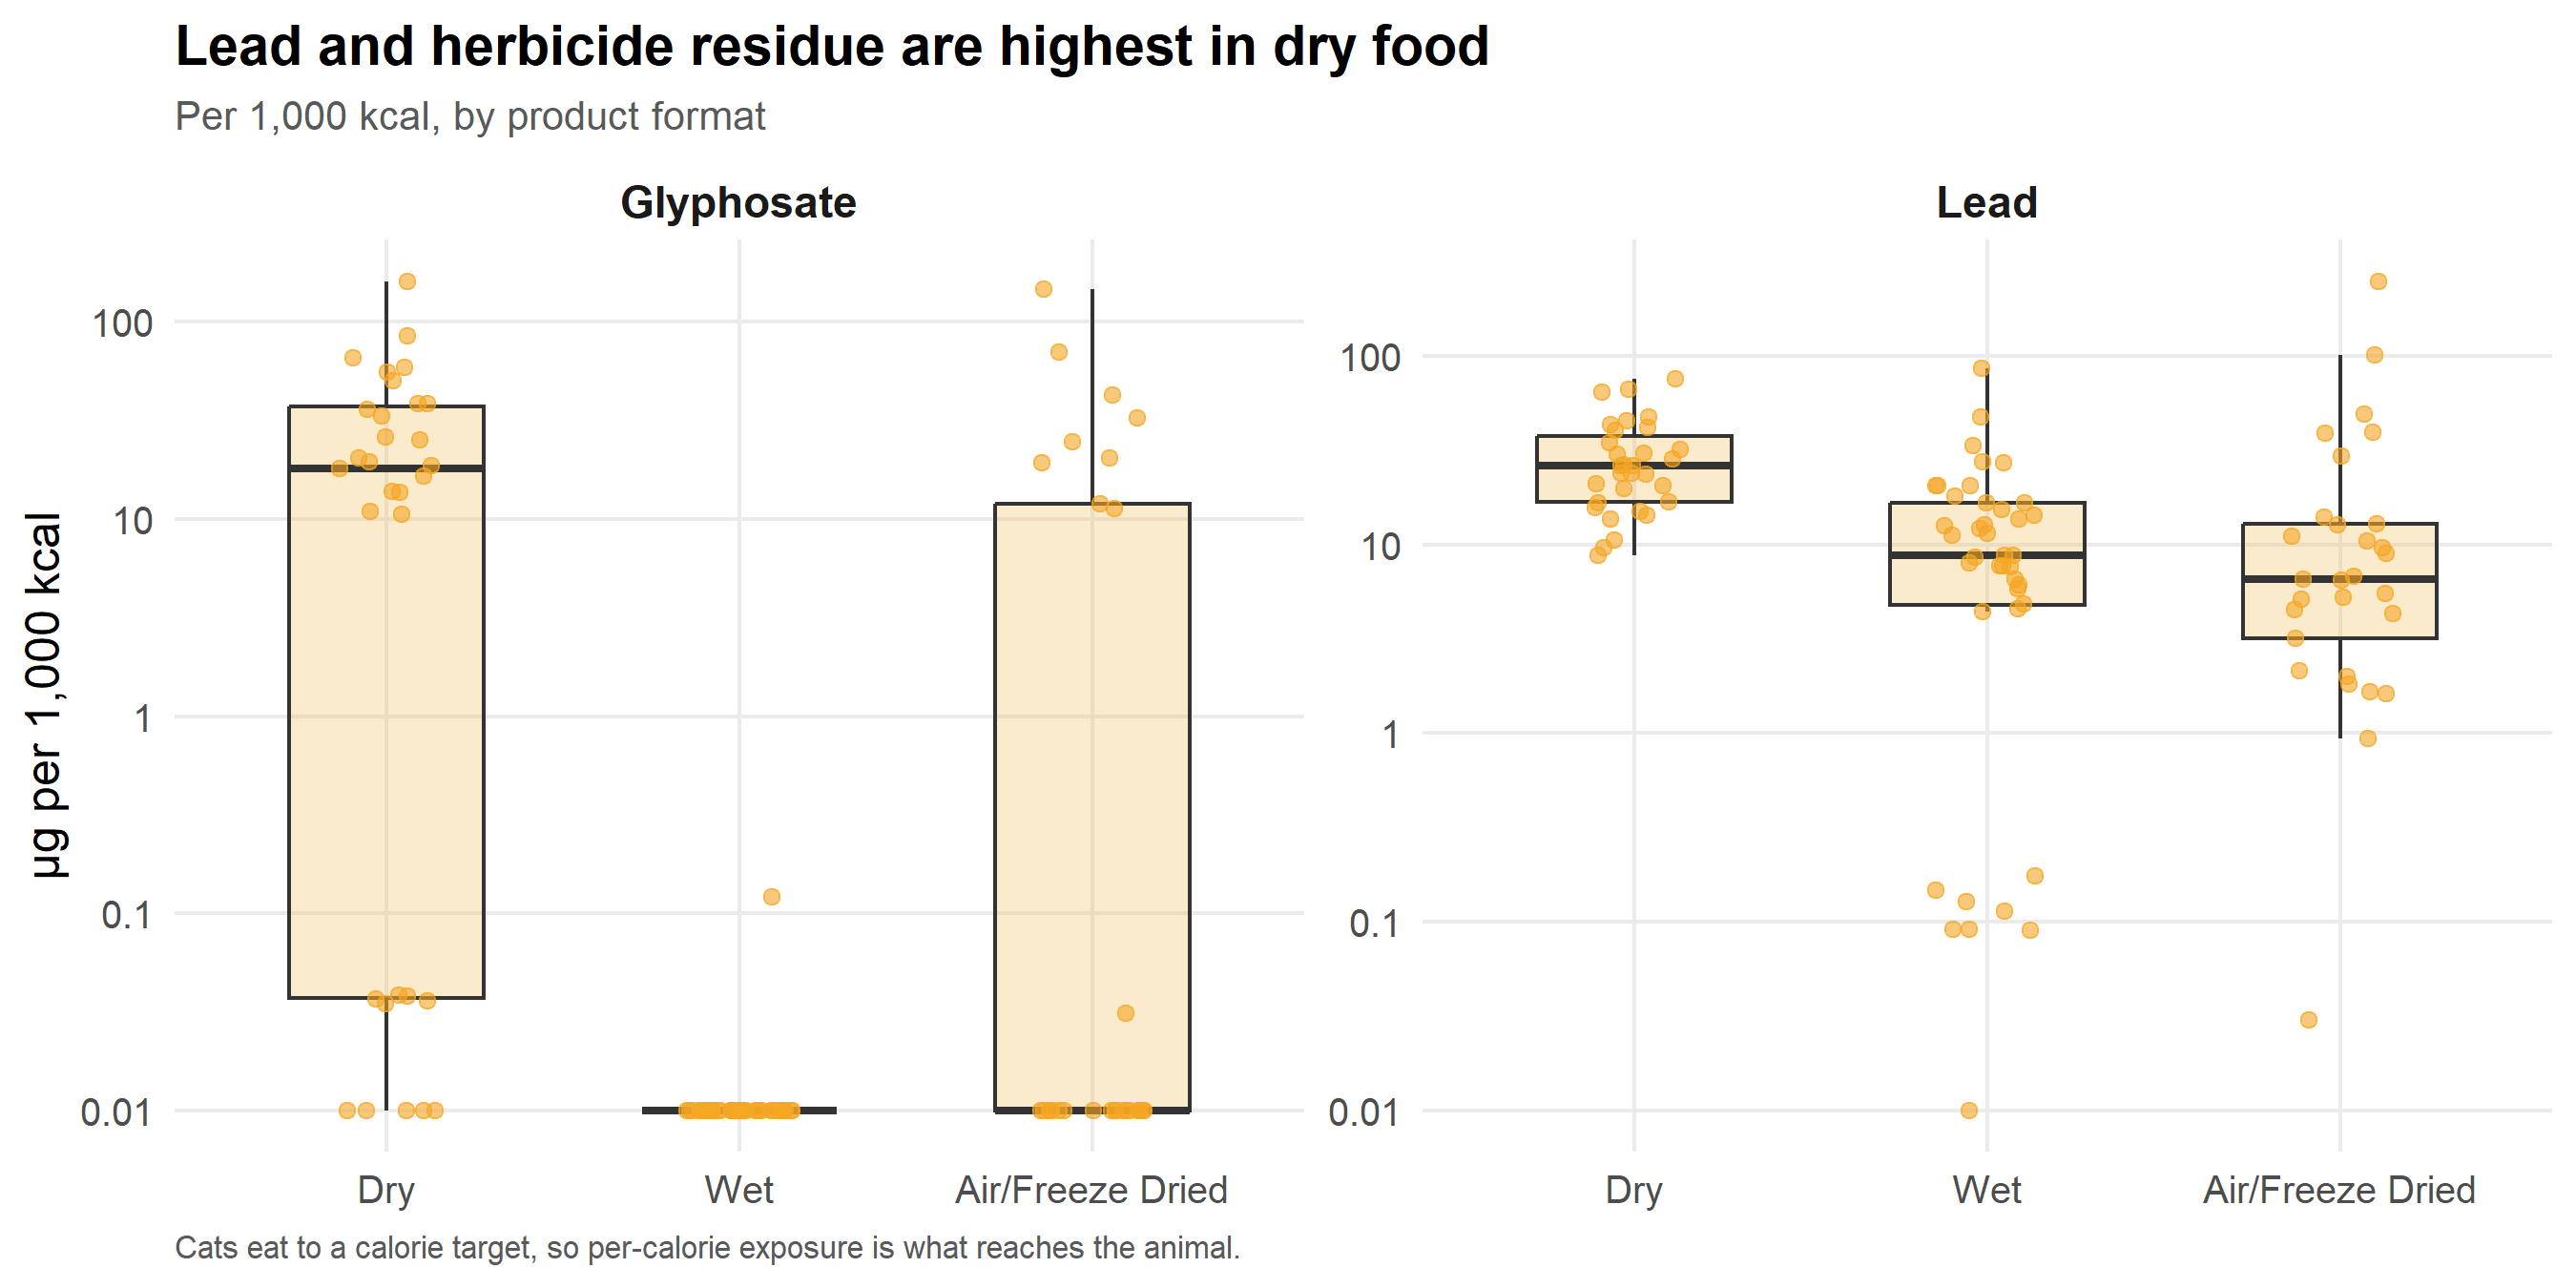
Dry food had about 3x more lead than the other two formats after accounting for calories, and this difference remained true after considering the protein source. Unlike mercury, lead levels were not linked to a specific type of protein. This suggests that the format of the food — not a particular ingredient we examined—may play a role.
Fish-based products had about 2.5x more cadmium than other products. Marine animals, especially shellfish and other invertebrates, can naturally accumulate cadmium from their environment, making fish-based ingredients likely the source of this difference.
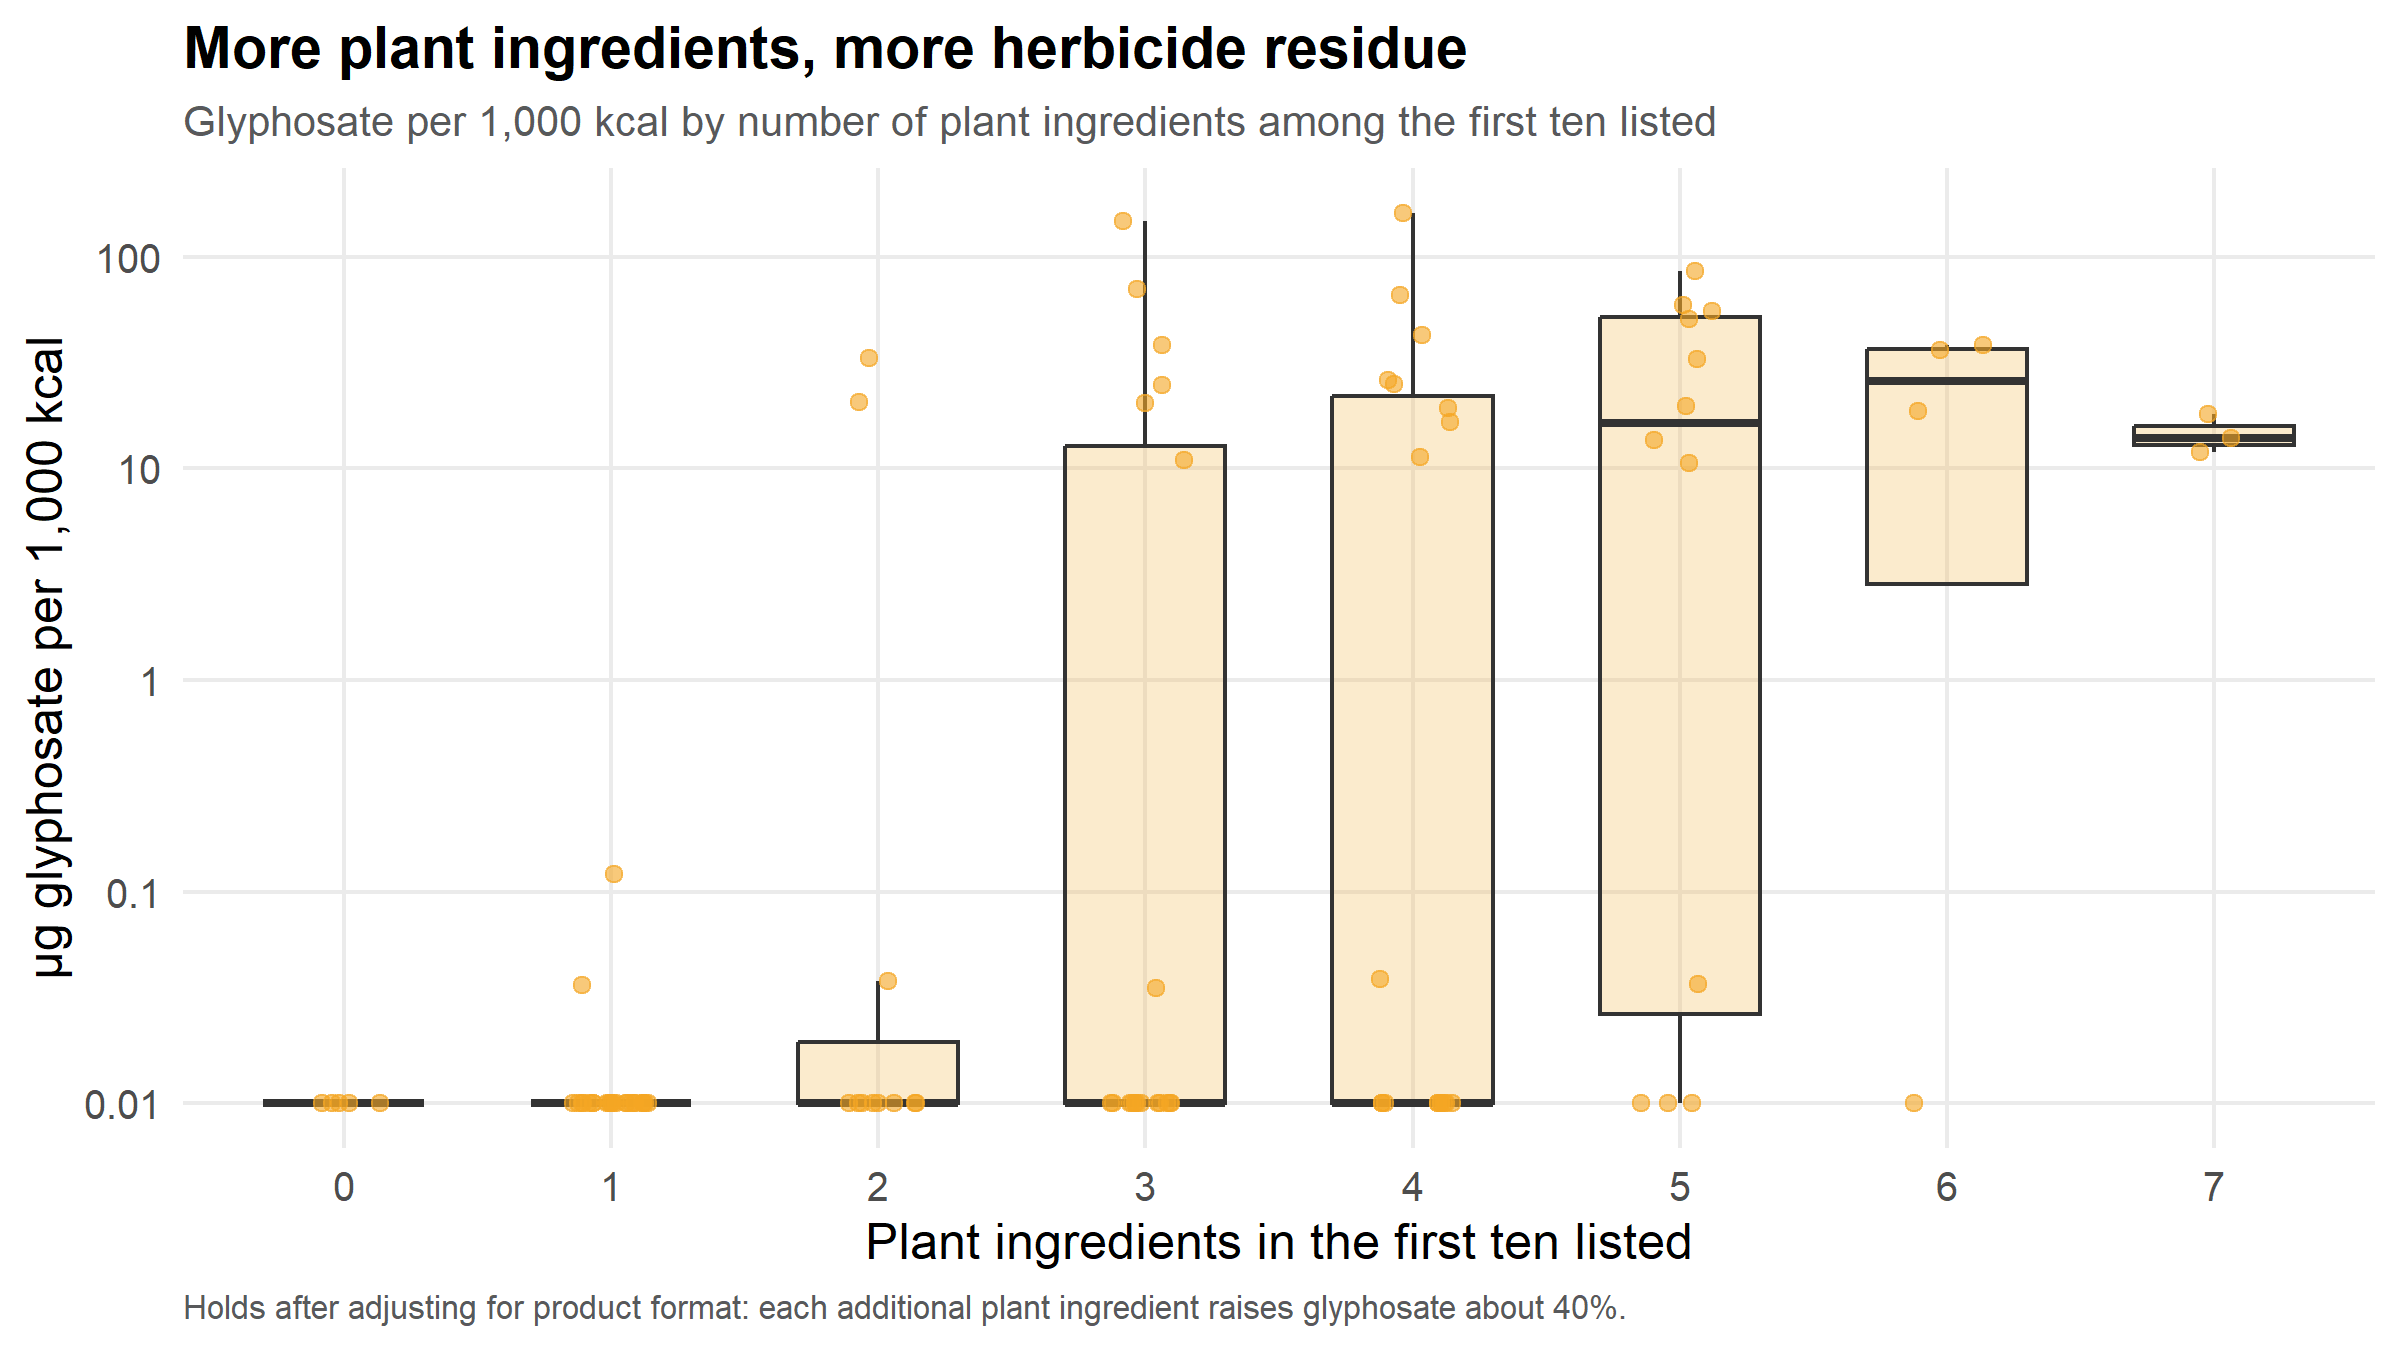
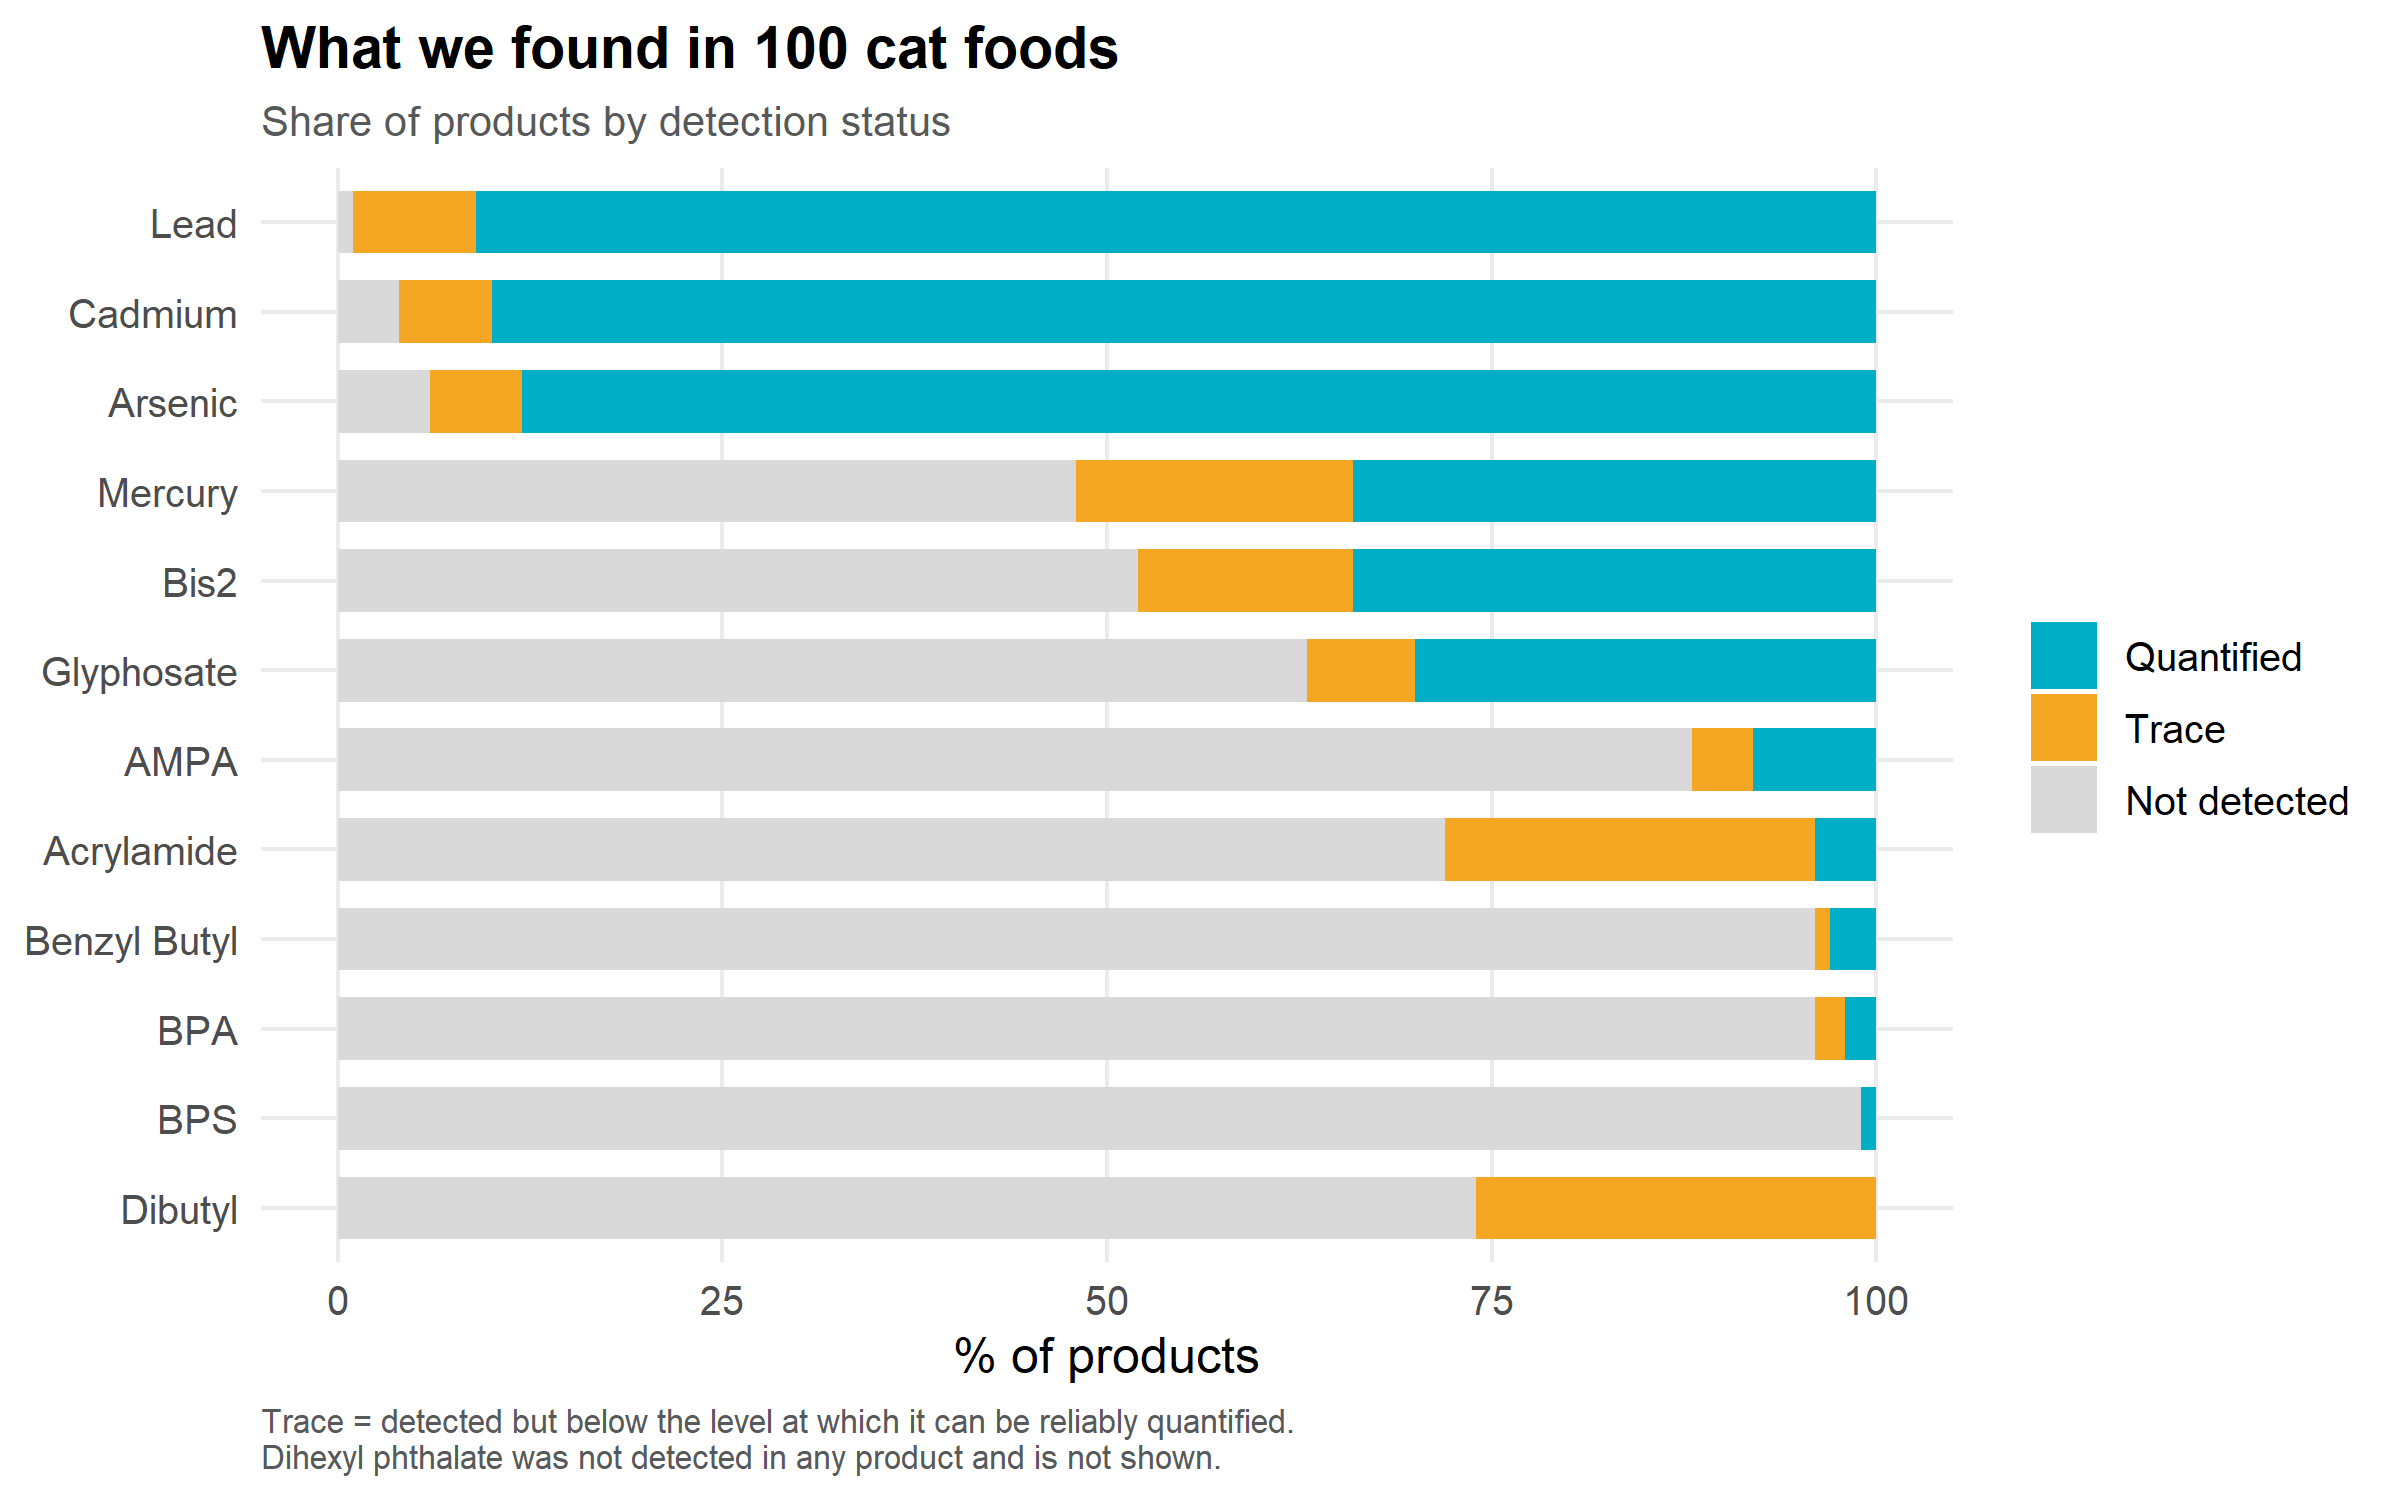
Glyphosate was found at detectable levels in 37% of products and its breakdown product AMPA was found in 12%. Products with more plant-based ingredients tended to have higher glyphosate levels. This is not surprising, given that glyphosate is a widely used herbicide applied to crops and other plants. Each additional plant ingredient among the first 10 ingredients was associated with about 40% higher glyphosate levels. The total number of plant ingredients mattered more than their position on the ingredient list.
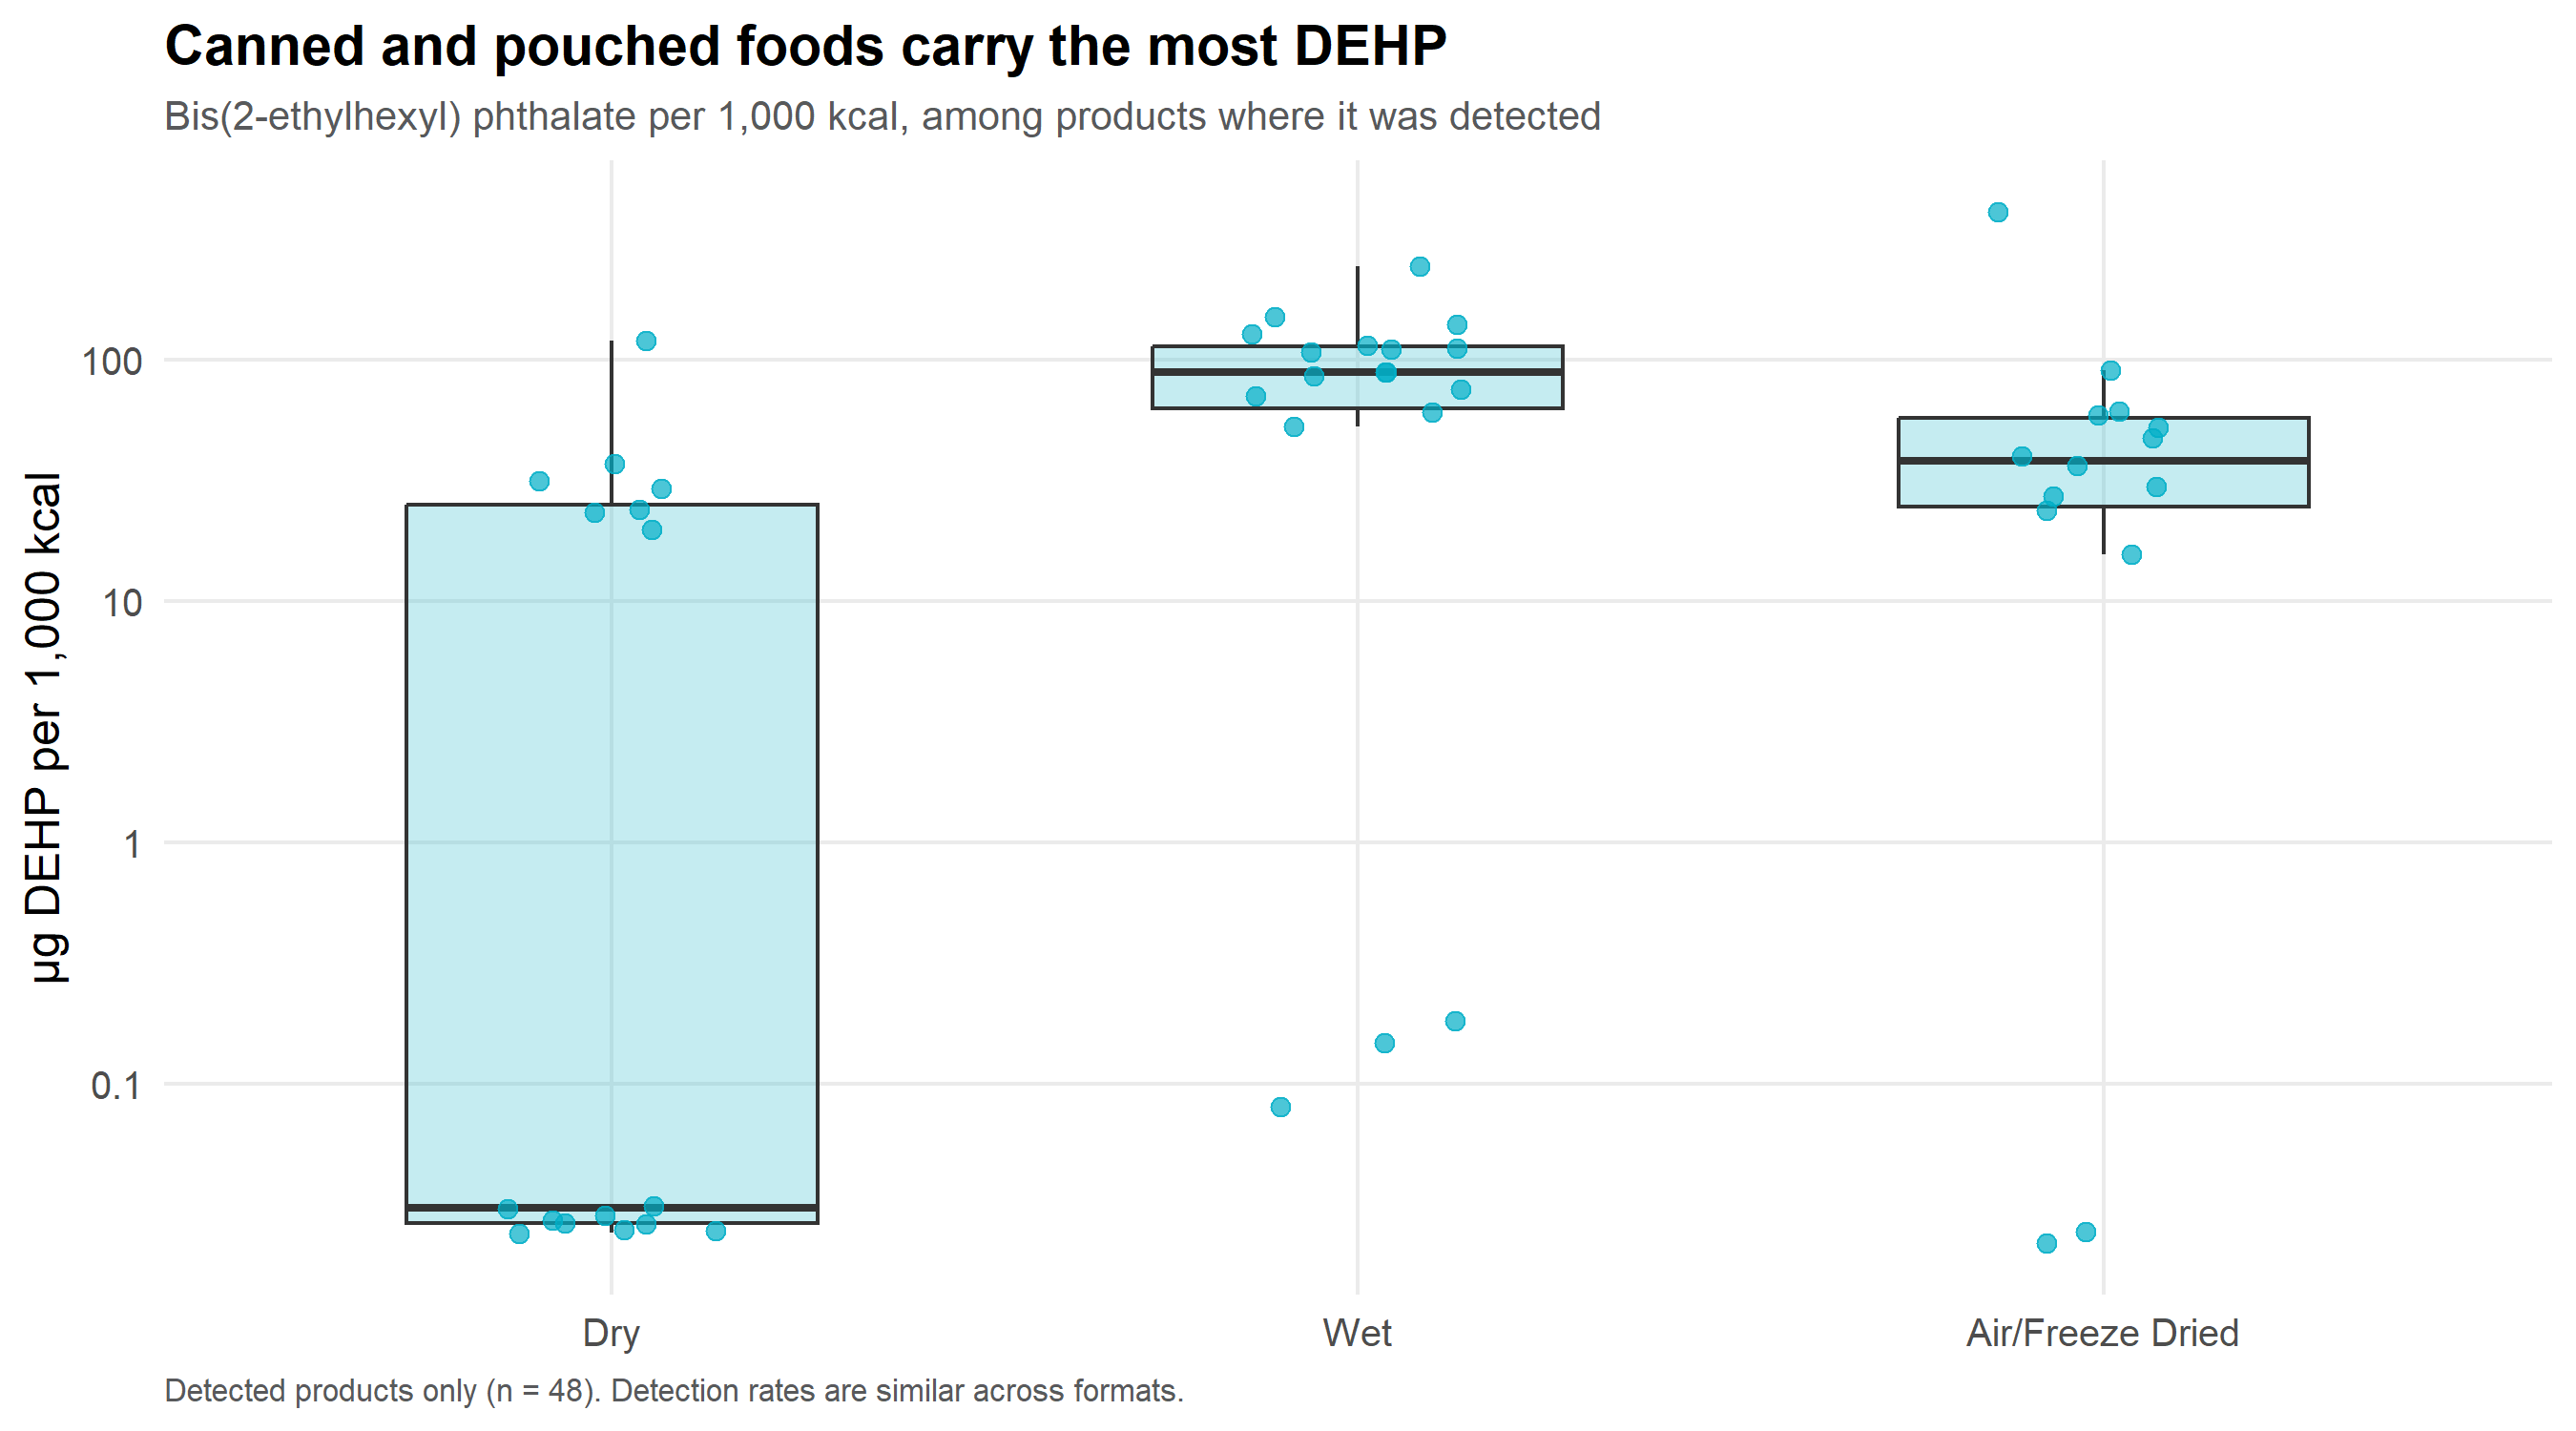
Bis(2-ethylhexyl) phthalate (“DEHP”) was detected in 48 of 100 products Clean Label Project® evaluated. DEHP stood out from every other contaminant we tested. It was found at similar rates in both dry and wet foods, with about half of products in each format showing detection. But where it was found, canned and pouched products had about 5x more DEHP than bagged products. Because DEHP is used in flexible plastics and packaging materials, the difference may be related to food contact with packaging. Dibutyl phthalate was detected in 26 products but never at a quantifiable level. Dihexyl phthalate was not detected in
any product.
Acrylamide, a chemical that can form during high-heat cooking, was found at measurable levels in 4 of 100 products, and at very low levels in an additional 24 products. Bisphenols, chemicals that can interfere with hormones, were rarely detected. BPA was only found in two products and BPS in one. This reflects a broader shift Clean Label Project® has observed over the past nine years away from using bisphenols in food packaging materials.
The first ingredient on a food label is often the biggest selling point because ingredients are listed by weight. We tested whether that first ingredient actually tells the full story when it comes to contaminants. We checked whether that first ingredient tells you what’s actually in the food.
The Verdict: In more than a third of the products tested, it doesn’t. In 35 of 100 products, the first-listed ingredient was outnumbered by ingredients from a different category within the first ten items. Most often, a food’s first ingredient was meat or fish, followed by a top ten made up mostly of plant ingredients—including, in some cases, different components of the same plant ingredient, such as pea protein and pea flour. This means that even when meat or fish is the first-listed ingredient, it may not make up the majority of the food’s overall ingredient makeup.
There are a few explanations for this pattern. A single crop can legitimately appear several times in a list because different parts of the crop do different jobs in the recipe. But in some cases listing one crop (or similar crops) several times in different forms can also have the effect of pushing the crop ingredients further down the list of ingredients, making the headline ingredient look more dominant than it really is. The industry term for this is “ingredient splitting,” and while it is allowed in commercial pet food manufacturing, it can sometimes give consumers the wrong impression of the primary ingredients in their cat food.
Three findings stand out: the first ingredient is not always a reliable indicator of what a food is mostly made of; it does not necessarily predict which contaminant may be present at the highest levels; and products in which the first ingredient was outnumbered by other plant ingredients nearby tended to have higher levels of lead.
The pattern is flat across formats: 35.5% of dry, 35.0% of wet, and 35.7% of air-dried products.
Combining the results of the current study with prior cat food testing conducted by Clean Label Project®, we now have 541 samples across 87 brands—enough data to examine which individual ingredients are associated with higher heavy metal levels. Unsurprisingly, most of the most problematic ingredients come from the sea:
Heavy metals are carcinogens and neurotoxins that occur naturally in soil and water and enter cat food through both plant and animal ingredients. In our testing, mercury and cadmium were most closely linked to marine ingredients. Lead showed a different pattern, with higher levels in dry food that were not tied to any one ingredient type. Glyphosate was associated with plant-based ingredients, while DEHP and bisphenols were linked to packaging. The near absence of bisphenols reflects meaningful changes in packaging practices across the industry.
These contaminants are not intentionally added to cat food. However, brands can reduce their presence through thoughtful ingredient sourcing, supplier testing, and quality controls. Some brands have shown that consistently lower contaminant levels are achievable, which is why Clean Label Project® recognizes them with its Purity Award.
Clean Label Project® recognizes the products that meet the highest standards for purity. The Clean Label Project® Purity Award highlights brands that demonstrate a commitment to transparency and reducing contaminants in their products.
The following companies have cat foods that are Clean Label Project Certified®:
Download a digital copy of our cat food contaminants study.
Discover 2026’s Highest-Rated Dry Cat Foods for Purity.
Discover 2026’s Highest-Rated Wet Cat Foods for Purity.